PEP II - 476 MHz Cavity Analysis
![]()
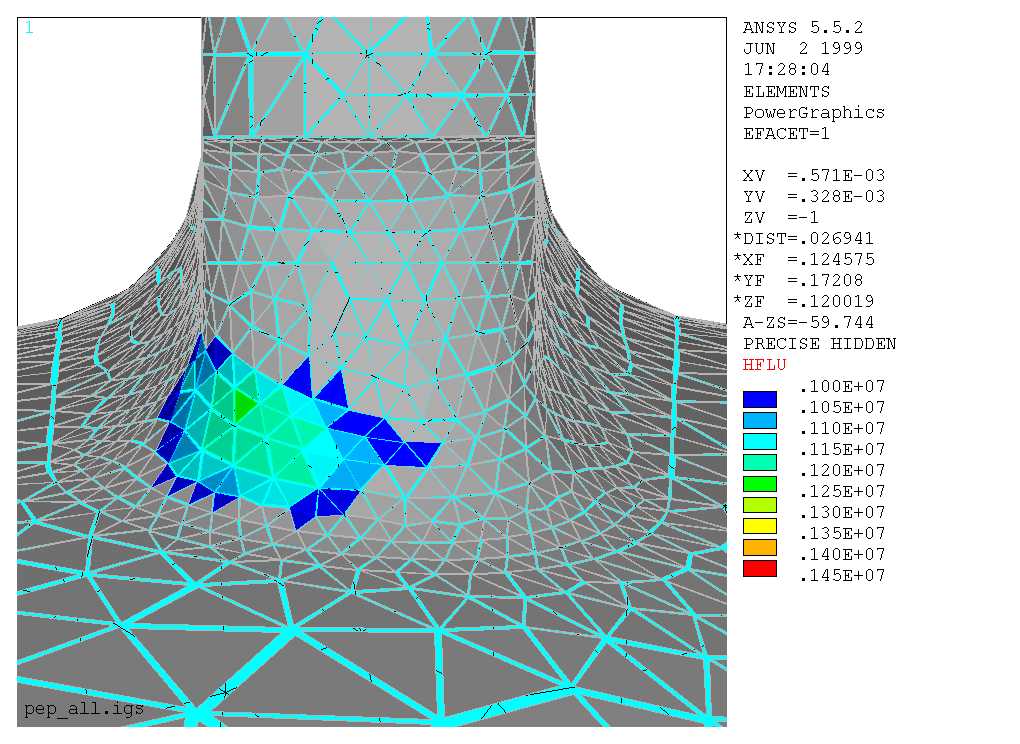
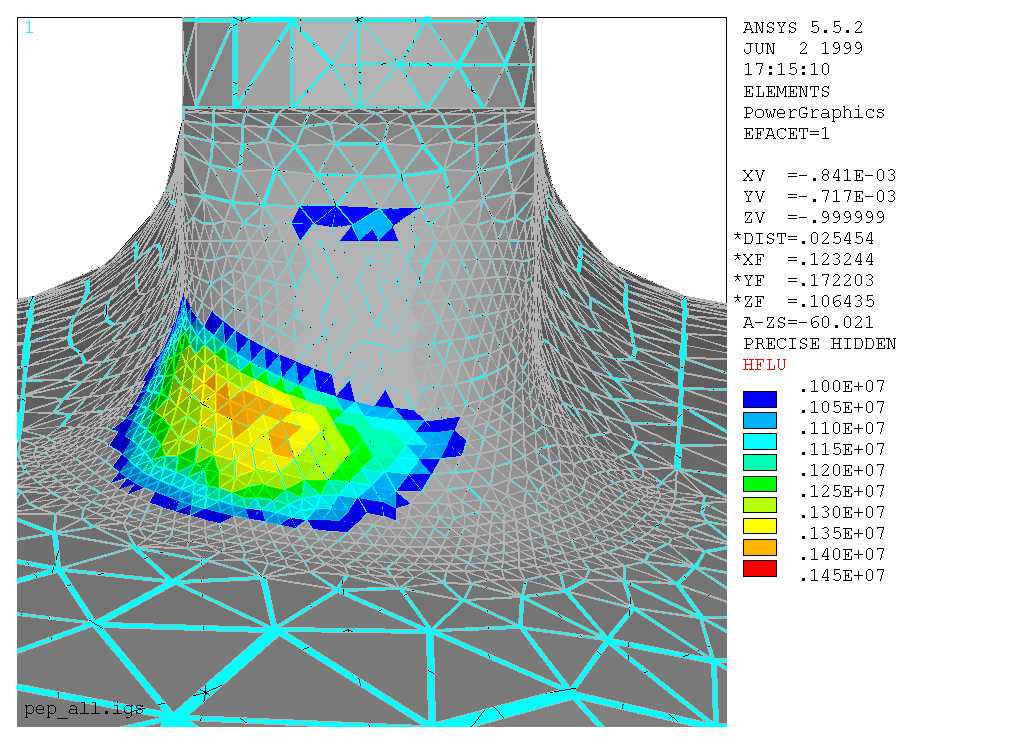
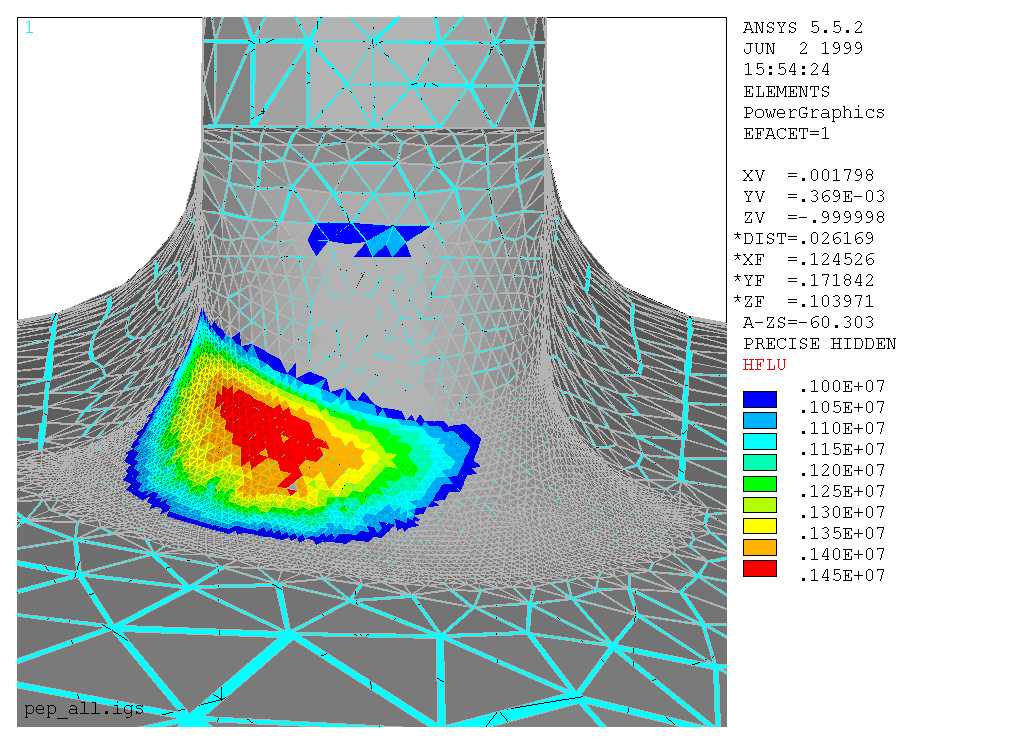
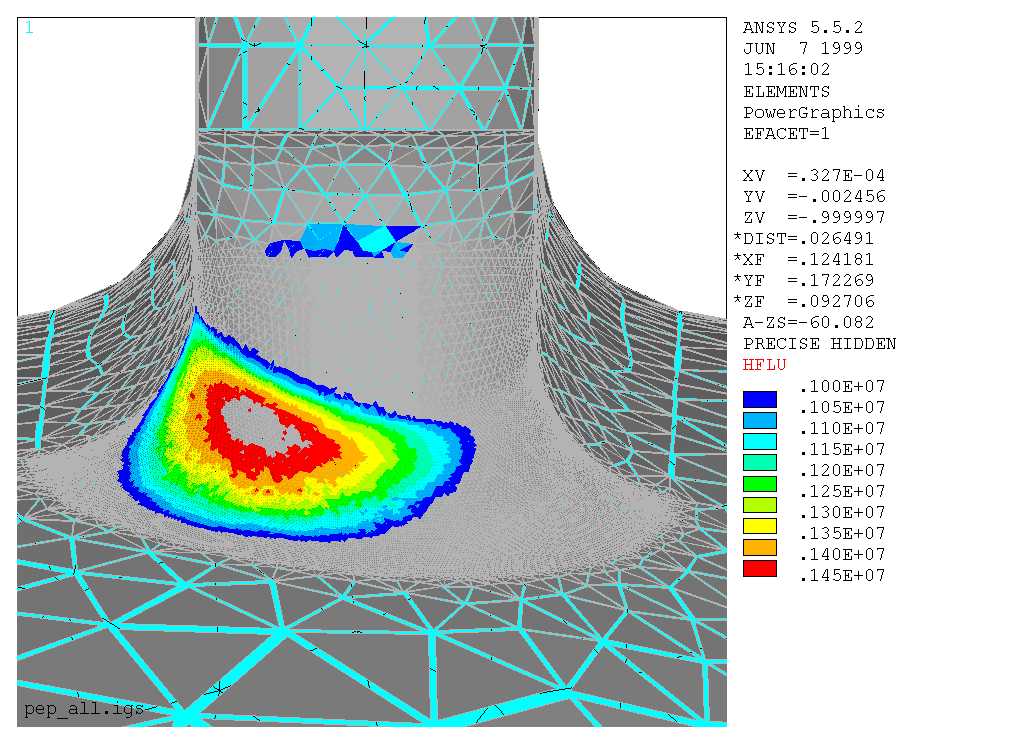
Heat Flux Results.
The following images document some of the PEP II 476 MHz cavity analysis (scaled from the 714 MHz design). The model consists of a 1/6 symmetry model, which contains the HOM and beam ports, but not the input coupling port. The four pictures below show the heat flux magnitudes (W/m^2) at the bottom curve of the HOM port, during four different mesh revisions. The differences between the mesh sizes in the different models are not necessarily uniform. Each subsequent model was created using the refine mesh command in Ansys, refining on the area under the hot spot, with minimal refinement (1) selected each time. All of the models were normalized to a total power loss of 150 kW.
Initial model - approximate smallest element edge length of 3 mm, Max HFLU of 121 W/cm^2.
Rev. 1 - approximate smallest element edge length of 1.5 mm, Max HFLU of 139 W/cm^2.
Rev. 2 - approximate smallest element edge length of 0.75 mm, Max HFLU of 145 W/cm^2.
Final Rev. - approximate smallest element edge length of 0.2 mm, Max HFLU of 149 W/cm^2.
![]()
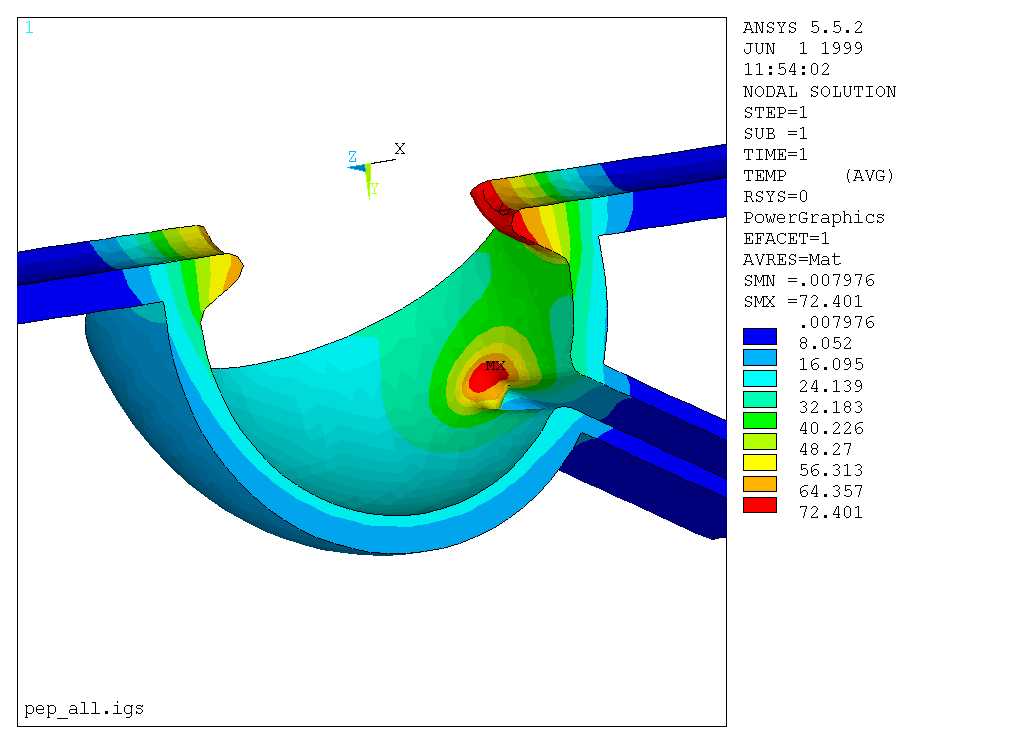
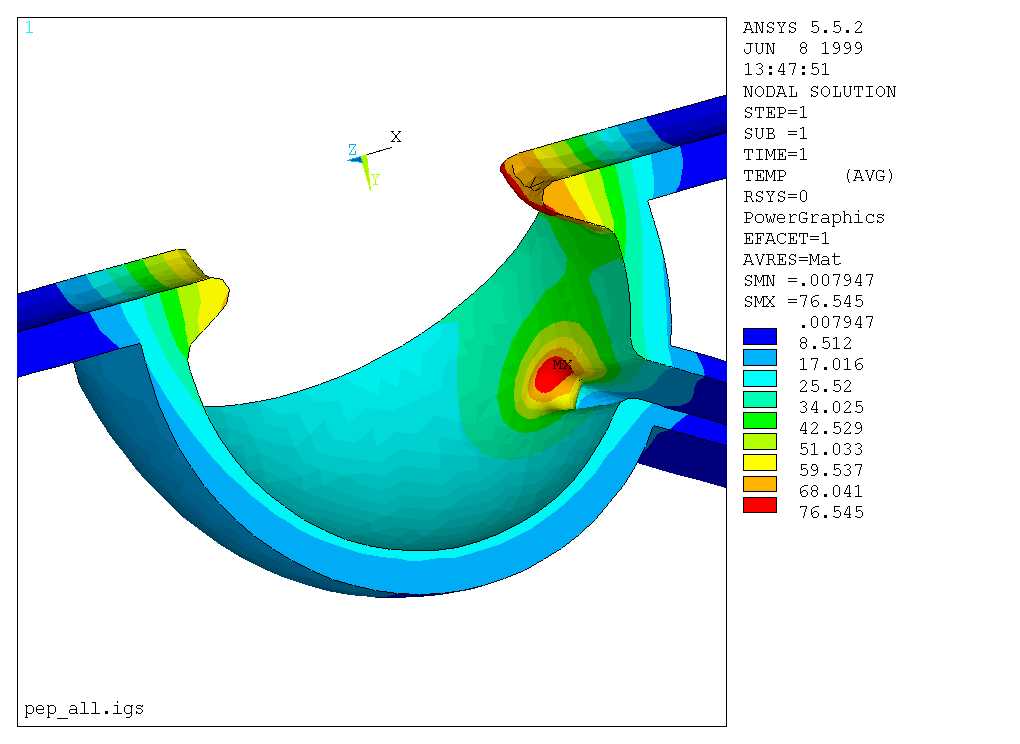
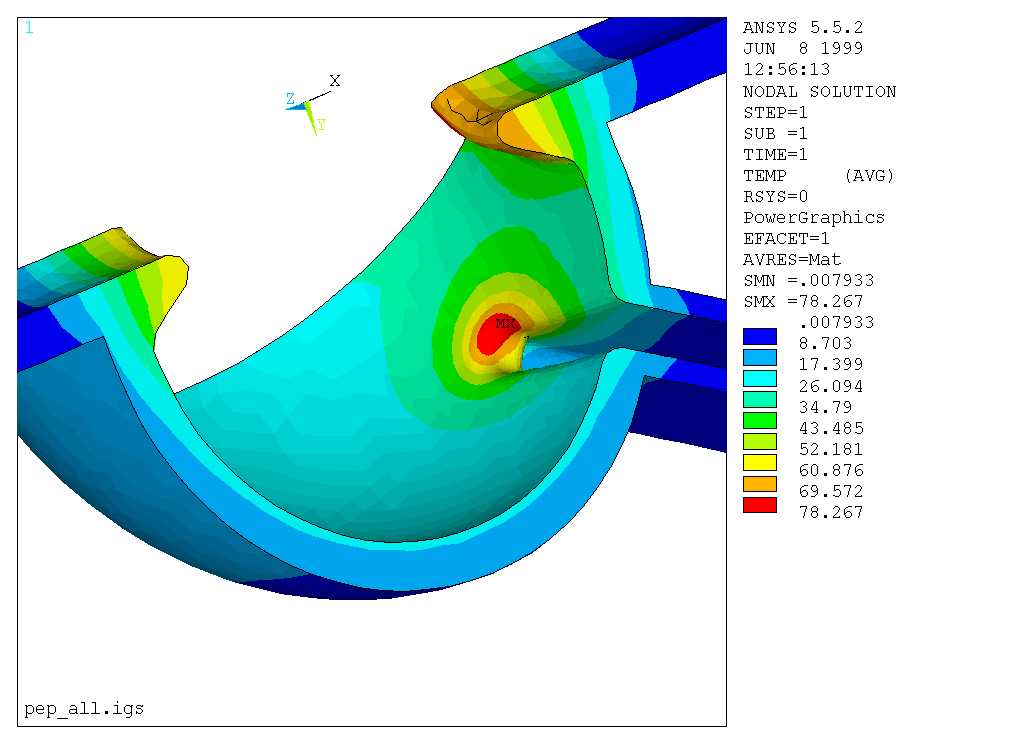
Thermal Results for First Three Models.
The following images show thermal analyses for the first three models above (Initial through Rev. 2). Each model was applied the same boundary conditions - a continuous convection coefficient of 15,000 W/m^2K on all of the "backside" surfaces (simulating a continuous waterjacket). All temperatures are give in Kelvin, in units above water temperature.
![]()
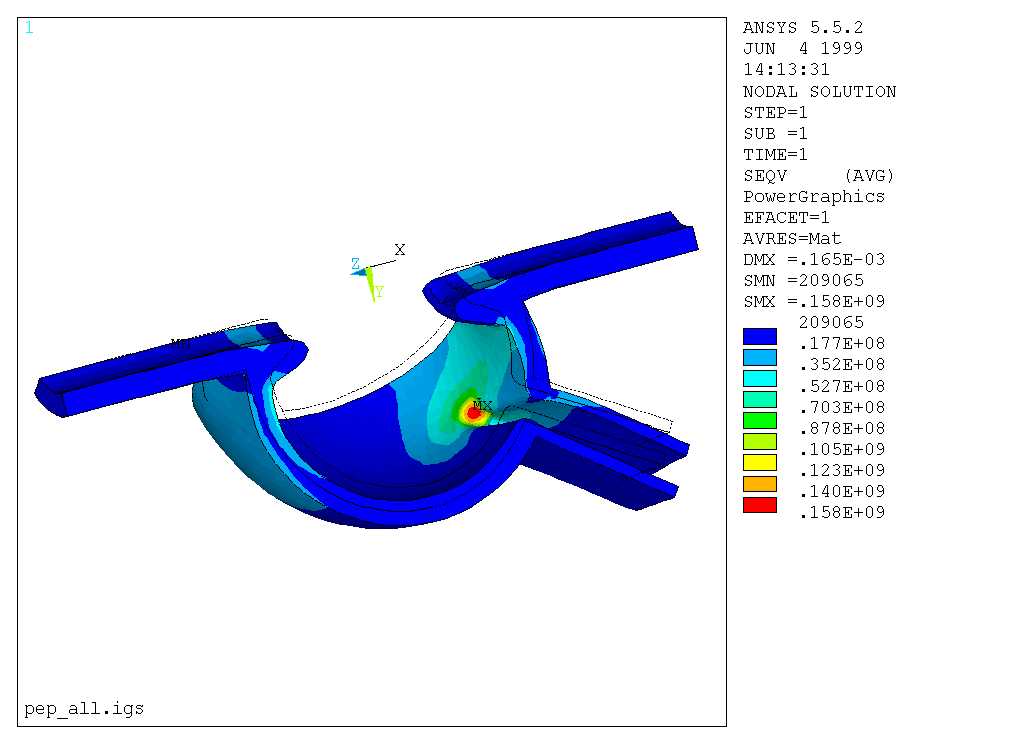
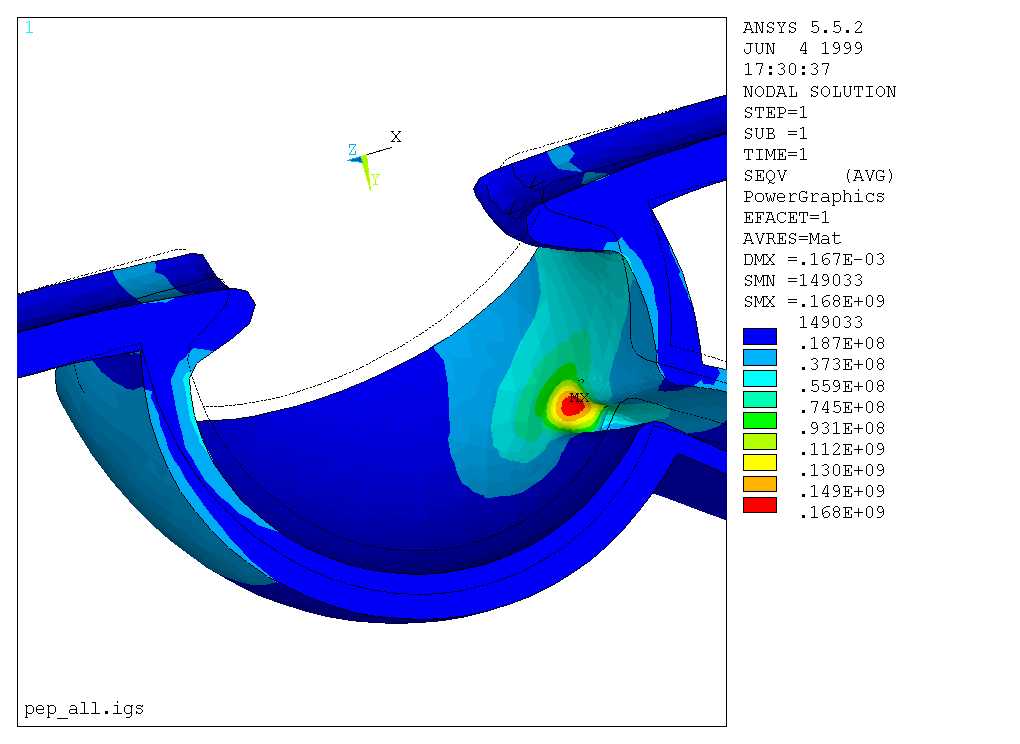
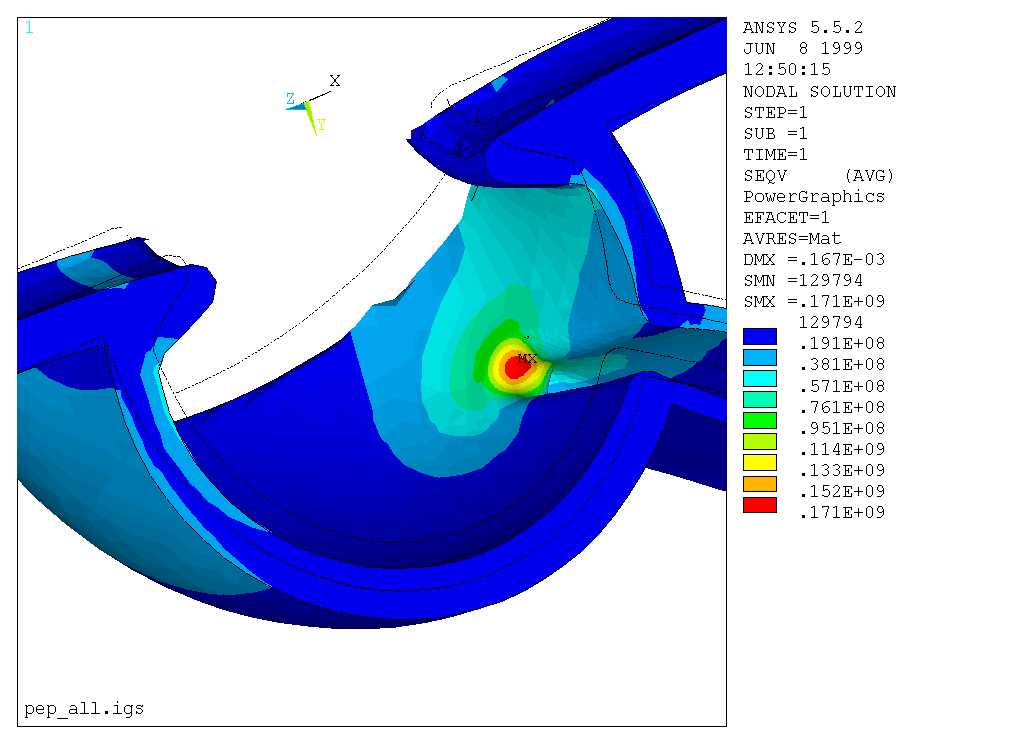
Structural Results for First Three Models.
The following images show stress analyses for the first three models above (Initial through Rev. 2). Each model was applied the same boundary conditions - symmetry constraints on the "sectioned" surfaces, as well as two constraints on the ends of the beam pipes. All results are in Pascals. Divide by 7000 to convert to PSI.
![]()